Every autumn, road managers walk into a budget meeting and lose an argument they should win — not because the roads are fine, but because "the roads are bad" is an opinion, and opinions compete with every other department's opinion. This is the three-slide structure that turns your road network condition into a funding decision the council can defend.
Before the slides, the mindset. Every vague claim has a quantified version that lands harder and shows it can be acted on. Bring the right-hand column to the room.
The rule: don’t present a feeling you can present as a figure. The rest of this playbook is how to source those figures.
The job of this slide: replace "trust me" with an objective, current snapshot.
Show the council the whole network graded by condition — how many kilometres are good, fair, and critical — with a hard date on the data. The power move is currency: most councils are deciding based on a survey that's three or more years old. A condition map from this season, not 2023, reframes you as the person who actually knows their assets.
Lead with the single number that creates urgency: "X km at critical risk." That's a specific, checkable, scary-but-credible figure — the opposite of "bad."
The job of this slide: prove that doing nothing is the expensive option.
This is where you win the fiscal conservatives
Frame it as a choice between two cheques: a small one now, or a large one — plus years of complaints and liability — later. "Good roads cost money; bad roads cost more."
The job of this slide: make saying yes easy, and make saying no a documented decision.
Don't ask for money for "repairs." Ask for a specific sum tied to a specific outcome, and show what each funding level buys:

All three slides need the same thing: current, objective, granular condition data — not a three-year-old consultant estimate. That's the gap Pluto closes. A smartphone on the windshield captures the network as vehicles drive their normal routes, grading over 65 damage categories by severity, so you can pull "X km at certain severites" on demand and visualized on a map you can zoom into.
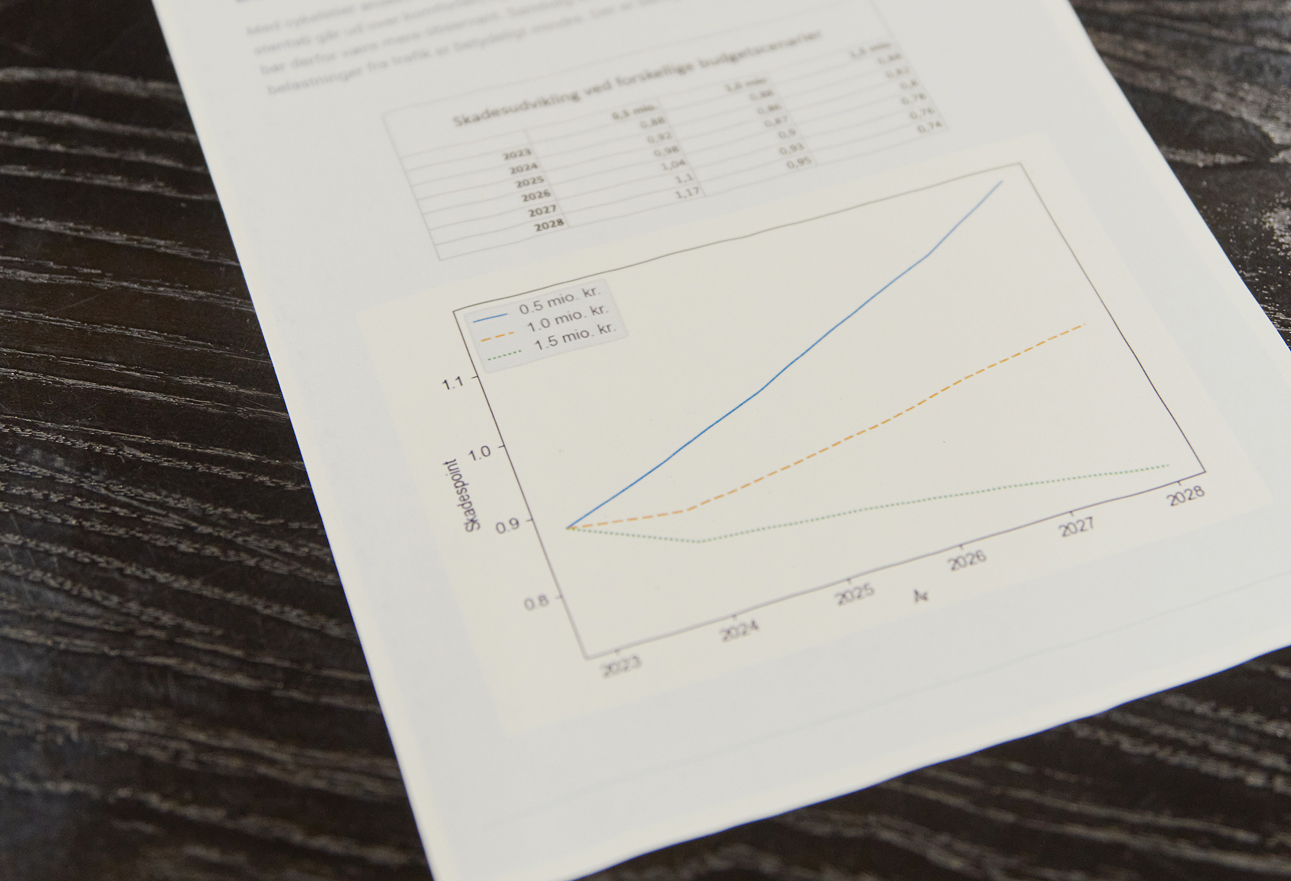
It's already being used exactly this way. As an example, Faxe Municipality generates reports for political presentations of its road network directly from Pluto data, simulating different budget scenarios so councillors can see what each spending level actually delivers (Faxe case). That's Slide 3, produced from live data instead of guesswork.
Politicians aren't rejecting your roads — they're rejecting vague adjectives. Walk in with three slides built on specific current data: where the network stands, what are the waiting costs, and exactly what the money buys. Turn "the roads are bad" into "45 km at critical risk, 6× cheaper to fix now" — and let the numbers help you pave the way.
At Pluto, we offer our clients full maintenance plans and presentation. The feedback has been very positive from politicians as they notice that data is transparent, objective and up to date. Contact us to hear more about our offerings.