There's a reasonable question behind every AI road survey: can I trust a number I didn't count myself? "Black box" is the usual objection — data goes in, answers come out, and nobody can explain the middle. So let's open the box. Computer vision isn't magic, and it isn't a person with perfect eyes. It's a specific, inspectable process — and understanding it is the difference between trusting your data and second-guessing it.
When you spot a pothole, decades of experience fire at once — depth, shadow, context, gut feel. It's fast and intuitive, but it's also subjective and inconsistent. Manual visual surveys are well documented as time-consuming and subjective, and hard to run consistently at network scale . Two inspectors rate the same road differently; the same inspector rates it differently on a Tuesday morning vs a Friday afternoon.
A computer doesn't "see" a pothole. It sees a grid of pixels and looks for patterns it has learned from tens of thousands of labelled examples. It has no intuition — but it also never gets tired, never loses focus, and applies the exact same standard to segment 1 and segment 10,000.
This is the part that makes the black box far less mysterious. For every detection, an object-detection model returns three concrete things:
That's it. No opinion — a labelled box with a number attached. You can draw every one of those boxes back onto the original image and check them yourself.
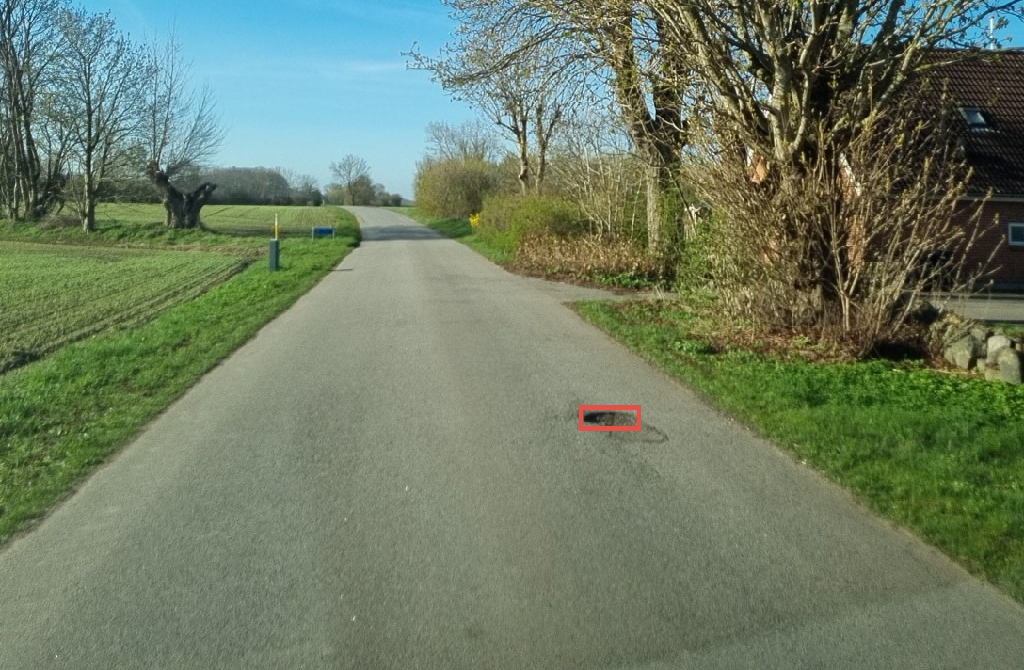
The confidence score is the model saying, in effect, "I'm this sure." A score of 0.95 means the model is highly certain; 0.35 means it's hedging. It's a genuine probability, combining how sure the model is that something is there with how sure it is about what it is.
The practical power is the threshold. Set it to 0.7 and only detections the model is at least 70% sure about get through; the rest are discarded. That's the dial that lets you tune for "flag everything, we'll review" versus "only show me what you're certain about" — a knob you control, not the model.
Yes — and this is where models genuinely diverge. A bounding box only gives an approximate location, but you lack information about the size and severity. Without this you cannot estimate costs, damage level, and prioritise the damage against all other damages of similar category.
Ask three questions. They cut through the marketing fast:
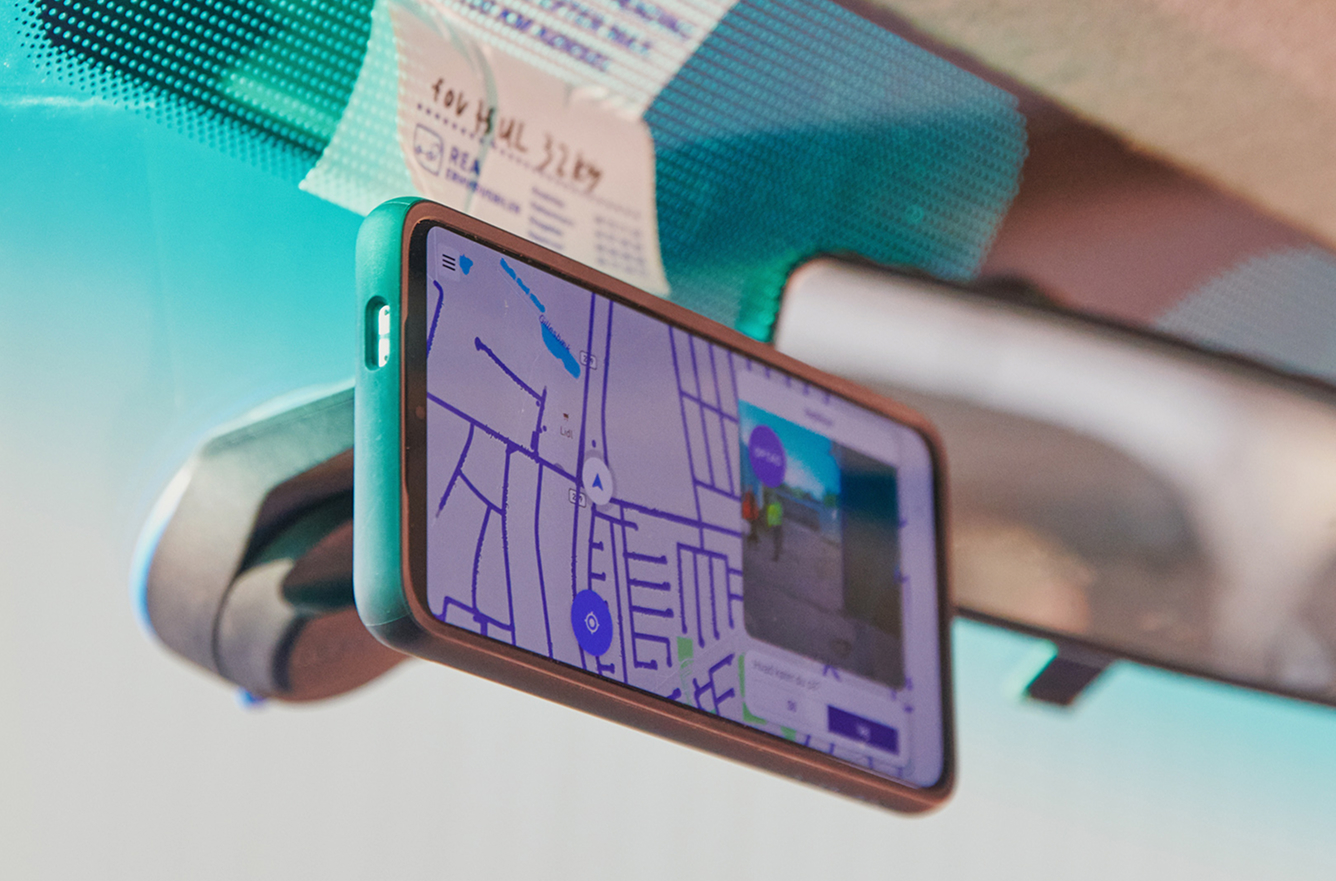
Pluto is built for this: a smartphone on the windshield, up to 65 damage categories, geo-tagged images every 5 metres, and severity grading so you can filter to what matters instead of drowning in it. Not all models are equal — and the difference is exactly the work you can't see in a demo.